CS 106 Winter 2016
Assignment 01: Input and output
Question 1 Haiku
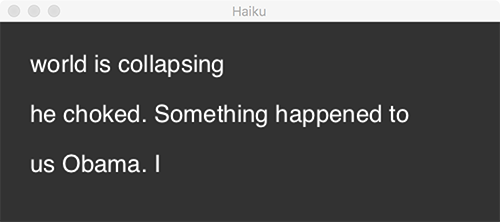
A haiku is a three-line poem consisting of a line of five syllables, a line of seven syllables, and a line of five syllables. You will write a sketch that displays randomly generated haikus, based on text from two external data files, containing five-syllable and seven-syllable lines of text.
To begin, download one (or more) of the following ZIP files, containing input data for the sketch:
- trump.zip: the transcript of a speech by Donald Trump
- prufrock.zip: T.S. Eliot's poem "The Love Song of J. Alfred Prufrock"
- sherlock.zip: a chapter of Arthur Conan Doyle's first Sherlock Holmes Story, A Study in Scarlet
Each ZIP file contains the files fives.txt and sevens.txt. Create a new sketch called Haiku and add those two files to it.
Now write a sketch that does the following:
- When the sketch first starts up, it draws a random haiku on the screen. As long as the user doesn't do anything, that's all that happens.
- When the user presses any key on the keyboard, the sketch clears the screen and draws a new random haiku. It then goes back to doing nothing.
Tips
- The files fives.txt and sevens.txt contain all the data you'll need for creating haikus. In your setup() function, use the built-in function loadStrings() to read them into two arrays of strings. Store the arrays as global variables.
- Draw the haiku by choosing a random line from the five-syllable array, a random line from the seven-syllable array, and a random line from the five-syllable array.
- You can choose any combination of background and text colours, window size, and font, as long as the text is clearly readable. The easiest way to draw larger text is with the built-in textSize() function. Optionally, you can play around with functions like textFont() and createFont().
- Ideally, each haiku only needs to be drawn once—you don't need to redraw it every frame. There's a neat trick for achieving this. At the end of your draw() function, put in a call to noLoop(). That tells Processing to stop drawing every frame. Then, when the user presses a key, you can simply call loop() to make Processing go through the draw() function one more time.
- Not counting comments, my solution is about 25 lines long.
Question 2 Arcs

Download the SVG files arcs1.svg and arcs2.svg, containing two orientations of a simple arrangement of two quarter-circles. Each SVG file has size 50×50.
Now write a sketch called Arcs that draws a grid of these two tiles. Each cell in the grid can contain either of the two tiles; it's up to you to decide which one, according to any rule you want. At a minimum, you must have the following:
- The grid should be at least five tiles wide and five tiles tall.
- The tiles should fit together seamlessly. They should not overlap or have gaps between them.
- Each of the two SVG files must appear at least once in the grid.
- The grid should exactly fill the sketch window.
- After drawing the grid the sketch should simply freeze, displaying the same tile design forever.
Tips
- Because you need to draw only once, you can basically do all the work in the setup() function. Just load in the two SVG files and then walk over the locations in the grid, choosing one SVG or the other.
- To draw your grid, you'll probably want to use a nested loop, a for loop inside of another for loop. For example, the outer loop might walk over the rows in the grid, and the inner loop would walk over the columns in each row.
Enhancements
This question has no required enhancements, but you are welcome to experiment with interesting patterns of tiles, to add transitions to new patterns when the user presses a key, or even to modify the two tiles (as long as they still form unbroken designs across their edges). If you make any interesting enhancements, be sure to add a comment explaining them to the top of your sketch. Any especially interesting enhancements may receive bonus marks.
Question 3 Bar chart
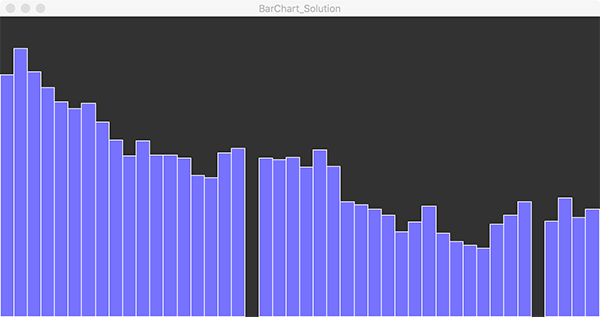
Download the file BarChart.zip, containing a starter sketch for this question. The starter code reads a file oilprices.txt, containing the daily price in US dollars for a barrel of crude oil in November and December 2015, excluding weekends. Two weekdays don't have prices: US Thanksgiving and Christmas.
Now add the following functionality to the sketch:
- The draw() function should clear the sketch window and draw a bar chart based on the oil price data.
- Use the built-in map() function to map the heights of the bars so that the bottom of the sketch window is at $30 and the top is at $50.
- All the bars should have the same width.
- The chart as a whole should exactly fit the width of the sketch window. (It will help to measure everything with floating-point numbers, not integers.)
- You should leave a gap in the chart for weekdays when no oil price is available, as shown above.
- When the user presses the space key, the sketch must save the bar chart into an external PDF file. Use the method discussed in lectures, based on beginRecord() and endRecord(). Save the PDF only once when the user presses a key, not every frame. The Module 02 sample sketches demonstrate how to make sure this happens.
Enhancements
This question has no required enhancements. But there are many obvious ways to improve the presentation of these data. Consider adding insets around the bar chart (in which case you don't need to fill the whole window), adding axes, lines and labels for prices, a title for the chart, and the other bells and whistles that make charts easier to read. If you make any interesting enhancements, be sure to add a comment explaining them to the top of your sketch. Any especially interesting enhancements may receive bonus marks.
Submission
Remember to review the Code Style Guide and use Processing's built-in auto format tool. Then review the How To Submit document. At the top of all of your source files, be sure to include a comment with your name and student ID number. When you're ready, zip all the sketches created above (Haiku, Arcs, and BarChart) into a single archive called A01.zip and upload that file to LEARN.