CS 106 Winter 2016
Lab 10: Tables
Question 1 Reading a table
Larry Winner maintains a web page containing numerous miscellaneous datasets. One of them consists of the heights, weights, positions and ages of basketball players in the 2013–2014 NBA season. I have converted the file into a CSV so that we can use Processing to analyze it. In order, the columns are:
- Player name
- Position: "G" for Guard, "F" for Forward and "C" for Center
- Height in inches
- Weight in pounds
- Age in years
Download the starter code and open the sketch NBA. The sketch includes the NBA CSV file in its data/ folder. When you run it, it attempts to display a few basic summary statistics about the players:
- The total number of players
- The number of Forwards (denoted by an "F" in the "Position" column of the dataset
- The age of the oldest player
- The average height of all the players
- The average age of all the players
As provided, the starter code doesn't actually compute any of these numbers—the sketch shows zeros for all of them. Your job is to insert code into the setup() function so that all the stats displayed are correct relative to the provided dataset. Roughly speaking, you'll need to write a loop that walks over the dataset, gathering information piece by piece, until at the end of the loop you can finalize all the numbers. (If it's easier to think about computing each stat in isolation, you can write multiple distinct loops.) Put your answers into the local variables in setup() so that they'll be displayed correctly by the provided code. You shouldn't need to include a draw() function or write any other functions.
As always, don't calculate these stats via some other method (e.g., Excel) and write fixed code that sets the variables to predetermined constants. You must compute these values from the CSV file. Put another way, if we substitute a different CSV file with the same column types, your code should still work.
Submit your work in a sketch titled NBA.
Question 2 Visualizating a table
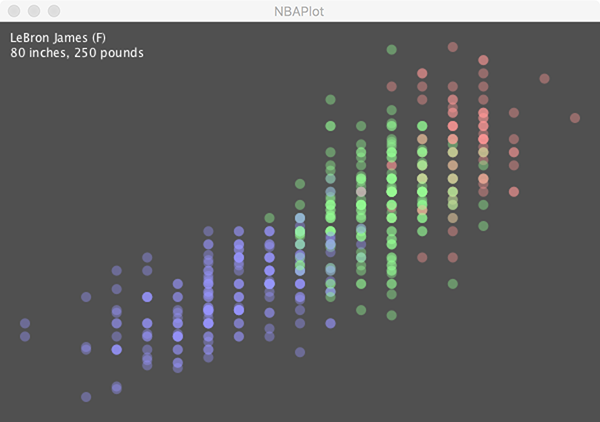
Using the same CSV file as above, create an interactive sketch that displays a scatterplot of player stats with heights along the X axis and weights along the Y axis. You must support the following requirements and features:
- The sketch should have size at least 600×400. You can use any background colour you want.
- Player height and weight information should be scaled to fit the sketch window. In setup(), you'll need to compute the minimum and maximum height of all players, and the minimum and maximum weight. Then, when plotting each point in draw(), use map() to map the height from the range of all player heights to a range of X values in the sketch window. Use map() for weights as well. Use a margin around the edges of the sketch so that plotted points don't lie right on the edge. (I used a margin of 25 pixels).
- Plot each point as a small circle. I used a diameter of 10 pixels.
- Use three different colours for the points: one for Forwards, one for Guards, and one for Centers. You can use any three colours you want (as long as they're distinct), but make sure to turn off outlines (strokes), and make them partially transparent.
- Every time draw() is called, perform a hit test with the mouse position against every circle being drawn. If the mouse is inside a player's circle, display that player's name, position, height and weight in the top-left of the sketch, as shown in the screenshot above. If the mouse is not hovering over any circle, don't display any text.
Save your work in a sketch titled NBAPlot.
Submission
Remember to review the Code Style Guide and use Processing's built-in auto format tool. Then review the How To Submit document. At the top of all of your source files, be sure to include a comment with your name and student ID number. When you're ready, zip up your L10 folder, which contains the NBA and NBAPlot sketches. Upload the file L10.zip to LEARN.