CS 106 Winter 2016
Lab 11: Hierarchical data
Question 1 Analyzing a Tumblr blog
It's pretty easy to ask a Tumblr blog to spit out its contents as a JSON file instead of formatted HTML. Just add /api/read/json onto the URL for the blog. For example, the JSON version of designcloud.tumblr.com is at designcloud.tumblr.com/api/read/json. (Actually, it's not quite that simple, since their website gives you back a Javascript variable declaration, not just the JSON itself; but we can easily strip off the excess using text processing tools.)
In the starter code, open the sketch named TumblrAnalysis. In that sketch's data/ folder you'll find a file called designblog.json, containing a snapshot of the contents visible at The Design Blog. Look over the JSON file and get a sense of what information it contains and how that information is laid out. At the top level, the JSON Object contains a field called "posts" that's associated with a JSON Array with per-post information. Each post includes lots of fields, including a main image at different sizes ("photo-url-1280", "photo-url-500", and so on) and a JSON Array called "tags". (Each post also contains a number of sub-images in the field "photos", but we won't use those.)
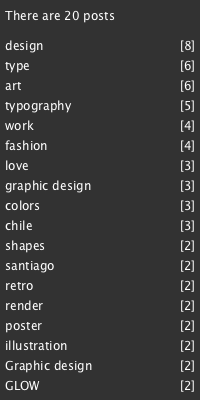
Based on this starter code, write a sketch that prints out a few pieces of information about the contents of the Tumblr. First, determine the number of posts in the top-level array of posts. Second, find all the tags associated with each post and tabulate how many times each of those tags is used across all the posts. Then display the number of posts and an ordered list of the 18 most frequently used tags, in descending order of use. For example, if I were to run this sketch on the current state of baunau.com, I would see this output in the sketch window:
To complete this question, proceed as follows:
- For this sketch you only need a setup() function that draws all the text. You don't need to include a draw() function. You don't need any helper functions, but feel free to include them if they make the code easier to write.
- Set the size of the sketch to 200×400. Choose any background and text colours that you want.
- To begin, load in the file designblog.json as a JSON Object. Find out how many posts it contains in its array of posts, and draw the message "There are N posts" at the top of the sketch window (where N is replaced by the actual number of posts).
- Now create an IntDict that will record the number of uses of each tag. The keys of the dictionary are the tags themselves, and each key is associated with an integer telling you how many times that key was used as a tag. Walk over all the posts and update the dictionary with all the tags you find in each post. (Note that this should be very similar to part of the WordCloud sketch from Assignment 08. If you're stuck, look at the sample solution for that sketch to see how the dictionary is used there. The simplest approach is to use the add() method in IntDict.)
- Order the contents of the dictionary from the most used tags to the least used. As with the WordCloud question, you can simply use the sortValuesReverse() method in IntDict, and then ask for the array of keys, which will now be returned to you in descending order by number of uses.
- In a loop, draw each key, together with its count in square brackets right-justified in the sketch window, as shown above. Use the built-in textAlign() function to get right-justified text. You can assume that there are at least 18 distinct tags.
The result will be similar to the screenshot above, but with different tags (because it will be built from a different blog's information). Your code should work on any Tumblr blog in which every post has a set of tags. Obviously your solution should not have the post count of any of the tags hard-coded—the information must be computed from the JSON file.
Submit your solution in a sketch titled TumblrAnalysis.
Question 1 Visualizing a Tumblr blog
In this question you will use the same JSON file as above, but you will actually show some of the content, not just gather statistics. In particular, every post in The Design Blog is headed by an image. You will write a sketch that displays those images in a slide show.
- Open the starter code for TumblrViz. The sketch includes another copy of designblog.json. It also comes with a helper class called ImageCache that helps you manage the loading of images over the internet. Please read the instructions at the top of the ImageCache tab to see how to use it. And make sure that you don't ever write loadImage() directly in your solution: let ImageCache handle it for you!
- Define a global variable of type int, which serves an index into the JSON array of posts.
- Notice how every individual post has a main image, which can
be loaded via a URL. Tumblr provides the image at different
sizes via the static URLs associated with the fields
"photo-url-1280", "photo-url-500", etc.
Set the size of the sketch to accommodate these images.
You'll find that the images you download all have the same size,
which should make this easy. If you want to get fancy, you can
set the size every time you display a new image using the code
surface.setSize( w, h );
where w and h are the width and height that you want the sketch to have. - In the sketch's draw() function, show the image associated with the current post (i.e., the one at the current value of the array index you defined in the previous step). Use JSON methods to get the URL associated with the "photo-url-500" tag of the current post. Then pass that URL as a parameter to the cache's getImage() method. (You can do this every time draw() is called, since the cache will make sure that the image is actually loaded only once.) That should give you back a PImage, which you can display in the sketch window.
- Finally, write a keyPressed() hook so that when the user presses the space bar, you advance to the next post (by incrementing the array index defined above). When you reach the end of the JSON array, cycle back to the beginning.
The end result should be a simple slide show sketch. You see a succession of images, and pressing the space bar allows you to advance through them.
There's a lot more information in the JSON file, a lot of other Tumblr blogs out there, and accordingly a lot of ways to enhance this simple sketch into something more like a full Tumblr app. Feel free to experiment with additions to the sketch. I created a separate version that includes a ControlP5 textfield. You can type in the name of any Tumblr blog, and the current contents of that blog will be downloaded on the spot and the images displayed live. Of course, any such enhancements are entirely optional. If you do add enhancements, feel free to include them in a separate version of the sketch.
Submit your solution in a sketch titled TumblrViz.
Submission
Remember to review the Code Style Guide and use Processing's built-in auto format tool. Then review the How To Submit document. At the top of all of your source files, be sure to include a comment with your name and student ID number. When you're ready, zip up your L11 folder, which contains the TumblrAnalysis and TumblrViz sketches. Upload the file L11.zip to LEARN.