CS 106 Winter 2017
Assignment 08: Text Processing
Question 1 Anagrams
Two words are anagrams if the letters of the first word can be rearranged to form the second word. For example, "process" and "corpses" are anagrams. You will write a sketch that allows the user to enter a word (well, any sequence of letters) and see all the words that are anagrams of the text they entered.
Download the starter code. Unzip it and open the sketch titled Anagrams. When you run the starter sketch, you will see a simple ControlP5 user interface with a text field at the top of the window. Enter a word in the text field and press return. The sketch will display a list of test words as a result.
You do not need to add any code to setup() or draw()—the important changes take place in the controlEvent() hook, in response to the user pressing return.
Comment out or delete the three calls to append(). They're just there as a demonstration of adding to the already defined array results.
In the provided code, the variable txt contains the letters the user entered in the text field. Add code that finds all the anagrams of txt. This involve iterating over all the words in the global word list words, checking if each given word is an anagram of txt.
It's not immediately obvious how to check whether two strings are anagrams. Here are two suggestions (you only need one of these):
Write code to take a string, and return a new string in which all the letters have been alphabetized. For example, "process" might become "ceoprss". Now, two strings are anagrams if they have the same alphabetized versions (for example, "corpses" would also become "ceoprss").
Alternatively, write code to take a string and turn it into an array of 26 integers, where each integer tells you the number of times a given letter occurs in the string. For example, "bubbles" might produce an array that begins {0, 3, 0, 0, 1, 0, ...} because it has zero "a"s, three "b"s, 0 "c"s, etc. Once again, two strings are anagrams if they have identical arrays.
Every time you find a word that's an anagram of txt, append it to results. If you do so correctly, the user interface will update to show all of the anagrams of the word typed in by the user.
With clever coding, these changes can be carried out in fewer than ten lines of code.
Bonus: For a few bonus marks, add code to setup() that finds the largest set of words in the provided word list that are all anagrams of each other, and prints them out to the console using println(). For example, "ate", "eat", "eta", "tae" and "tea" form a set of five anagrams, but there are larger sets. Of course, you can't find the set through some other means and then print it out directly—you must compute it from the provided word list. And your code must be reasonably efficient: it can't take longer than five seconds to find the largest set.
Store your solution in a sketch titled Anagrams in the A08 folder.
Question 2 Visualizing Punctuation
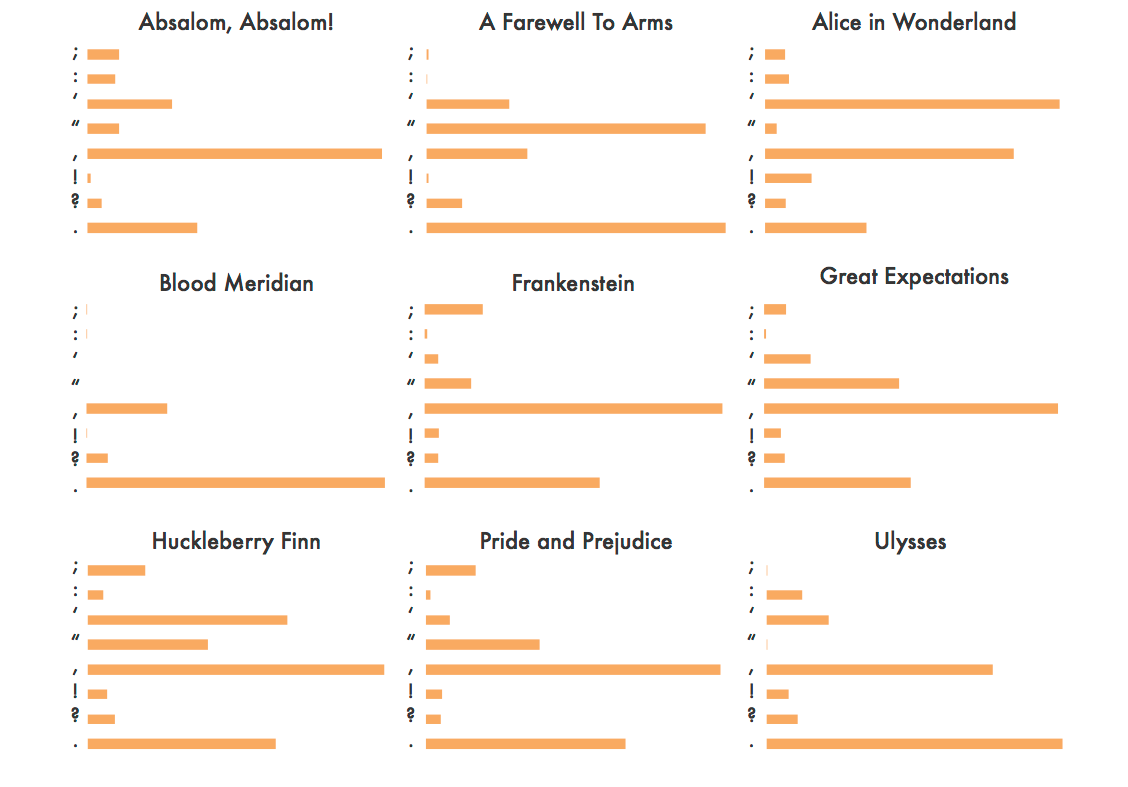
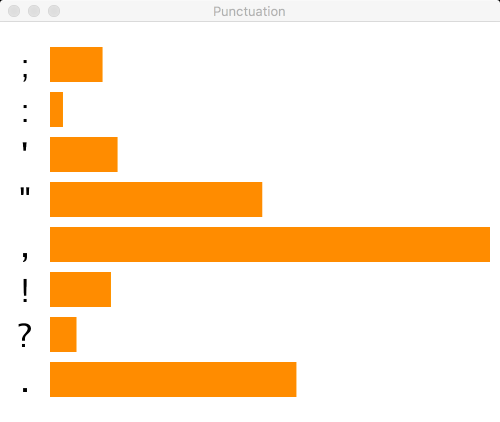
When we talked about text processing at a high level, we included a mention of some fun visualizations of punctuation in famous books. One visualization demonstrated on that page is the one above, which shows histograms of the distributions of common punctuation marks in books. We can immediately see that authors have different punctuation preferences. You will write a sketch that produces one of these visualizations based on a text file provided as input. For example, here's the histogram for A Christmas Carol, by Dickens:
Proceed as follows:
Create a new, empty sketch. Find a book you want to analyze. Feel free to choose any work of fiction you want on Project Gutenberg and download its text file, or simply use A Christmas Carol by following the link above (or taking the file from the sample sketches). Add the text file to the sketch. Set the sketch window to have dimensions at least 300×300.
Write a setup() function that reads the text file into the sketch and loops over every character, one by one. (You can simplify the code by using join() to turn the lines of the text file into one big String.) We'll fill in the loop below.
Create an IntDict variable that will map every individual character in the book to an integer, recording the number of times that character appears. As you process each character in the loop from the previous step, add one to the count for that character in the IntDict. (It may help to know that you can use the built-in str() function to convert a single char into a one-character String.)
We'll focus on the same punctuation marks from the original visualization: ";", ":", "'", "\"", ",", "!", "?", and ".". To draw the bar graph, you'll need to know which punctuation mark occurs the largest number of times; you can then scale the bars horizontally so that this bar extends to the right of the sketch window. This process is similar to computing the maximum value in an array, but requires looking up the counts for these punctuation marks in the IntDict.
Now draw a bar graph for the punctuation marks above. the bars should be scaled so that the mark occuring most frequently in your book extends to (or near to) the right edge of the sketch window. Each bar should be labelled with the relevant punctuation mark (drawn using the built-in text() function). You can draw the bar graph in setup() if you want, because it never changes. If you prefer to put it in draw(), that's fine too.
You do not need to include the title of the book in a header, as in the original examples. Feel free to experiment with the style of the visualization, as long as it clearly shows the relative frequencies of the different punctuation marks. We may award bonus marks to especially innovative or attractive visualizations.
Store your solution in a sketch titled Punctuation in the A08 folder.
Submission
When you are ready to submit, please follow these steps.
If necessary, review the Code Style Guide and use Processing's built-in auto format tool. You do not need to use the precise coding style outlined in the guide, but whatever style you use, your code must be clear, concise, consistent, and commented.
If necessary, review the How To Submit document for a reminder on how to submit to LEARN.
Make sure to include a comment at the top of all source files containing your name and student ID number.
Create a zip file called A08.zip containing the entire A08 folder and all its subfolders.
Upload A08.zip to LEARN. Remember that you can (and should!) submit as many times as you like. That way, if there's a catastrophe, you and the course staff will still have access to a recent version of your code.
If LEARN isn't working, and only if LEARN isn't working, please email your ZIP file to the course account (see the course home page for the address). In this case, you must mail your ZIP file before the deadline. Please use this only for emergencies, not "just in case". Submissions received after the deadline may receive feedback, but their marks will not count.