CS 106 Winter 2017
Lab 09: Tables
Question 1 Movie Ratings
The GroupLens group (a research group on social computing at the University of Minnesota) maintains a large database of movie ratings based on their MovieLens project. They offer access to large datasets of movie ratings for research (e.g., AI tools to predict what movies you'll want to watch). You'll use a small sample dataset from this group to create a sketch that shows ratings for movies.
Download the starter code and unzip it. Open the sketch titled MovieRatings. You'll see a starting point for the final sketch—all of the ControlP5 user interface code has been provided for you, and the needed data files movies.csv and ratings.csv are already in the data/ folder.
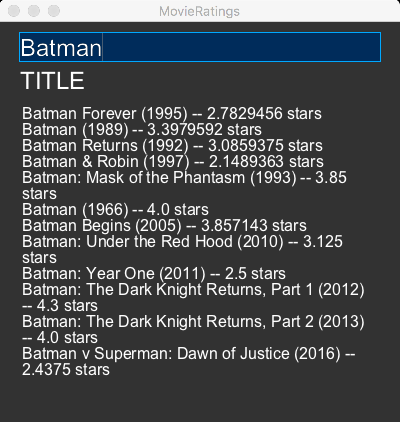
Take a moment to scan through the README for these CSV files. The most important section is "Content and Use of Files". The idea for the sketch is that you should be able to type all or part of a movie title into the text field at the top of the window, and the area at the bottom will display all the movies matching that title, each with an average rating based on the many individual ratings in ratings.csv.
Add two global variables to hold the tables in the two CSV files. Add code to setup() to load these files into the sketch. Both CSV files have header rows; make sure to take this into account when loading the tables.
The rest of the code can go into controlEvent(), though you might also benefit from writing one or two helper functions. When the user presses return in the text field, the text they typed in will be extracted into the provided variable txt in controlEvent().
Now iterate over the table of movies. For every movie whose title contains the user-supplied text (i.e., use the .contains() method of the String class), get that movie's ID number. Then, in a nested loop, iterate over all the ratings in the other table, looking for ratings for that particular movie. Add up all those ratings and divide by their number to get the average rating for this particular movie. (You'll need two variables as you iterate over ratings: one to count the number of ratings of this movie, and one to add the ratings together.) Add text to the Textarea recording the rating, as in the screenshot above.
The easiest way to add a sequence of lines to the Textarea is to create an empty array of Strings in controlEvent(). Every time you get a movie and its rating, append a string with all the information about that movie to the array. Finally, use code like area.setText( join( myArray, "\n" ) ); (as the last line in the function, like in the Anagrams question in Assignment 08) to fill the area with the movie titles and ratings, one per line.
You can complete this sketch with as little as 25–35 lines of code. When you're done, store your solution in a sketch titled MovieRatings in the L09 folder.
Question 2 Baseball Salaries
The highest single-year salary ever paid to a Major League Baseball player was $33,000,000 (thirty-three million dollars), which Alex Rodriguez received in 2009 and 2010, and Clayton Kershaw received in 2016. How have player salaries been evolving over time? Is everybody getting paid more, or only top players? You will write a sketch to visualize player salaries from 1985 to the present day.
Visit Sean Lahman's Baseball Archive and download the CSV version of the 2016 data. This is the same archive that we used for a few of the in-class table examples.
In a folder titled L09, create a new, empty sketch titled SalaryViz. Write a setup() function that sets the window size to at least 500×500. From the baseball archive, add the file Salaries.csv to the sketch. For this sketch, that's the only table you'll need.
Add code to setup() to load the table from Salaries.csv. Note that this table includes a header row.
In this exercise, we care about two fields in the table: the first field, named yearID, and the last field, named salary.
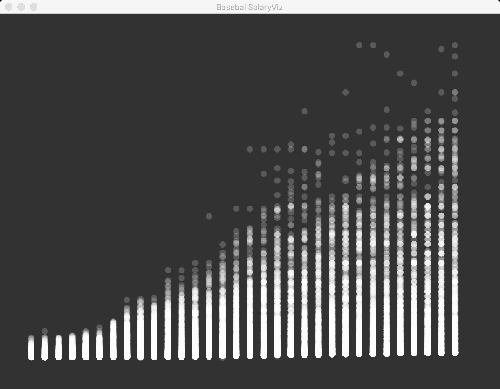
Loop over the rows of the table. For every row, draw a small semi-transparent circle whose x position is determined from the year and whose y position is determined from the given player's salary in that year. Use map() (or something like it) to ensure that the range of years 1985–2016 fills the width of the sketch (minus a margin on the left and right) and the range of salaries 0-33000000 fills the height of the sketch (minus a margin on the top and bottom). You'll end up with an image like this:
For this question, you're allowed to "know" going in that the highest salary in the table is 33000000. That is, you can put that into your sketch as a constant, you don't need to walk through the table to find the maximum salary (this will save a bit of coding).
That's the only required code in this assignment. Of course, there are many opportunities for enhancements, to improve the quality of the visualization. For example:
Add a title to the visualization.
Add annotations, like year numbers under the columns of dots, and horizontal lines marked with different salary levels.
Colour-code the dots in some way (National League vs. American League, one colour per team, player's country of birth, etc.).
Draw a line plot over the dots to show the trend in the average and/or median salary each year.
Add code to stretch the graph so that you can zoom in on the bottom part. (You'll see an interesting "stairstep" in the bottom of the graph that's not visible when zoomed out; is that a gradual increase in the salary floor?)
Add the ability to hover the mouse over any given dot, and pop up the name and salary (and other stats) for that player in the sketch window.
We'll award bonus marks to especially creative or innovative enhancements.
You can complete this sketch with as little as 25–35 lines of code. When you're done, store your solution in a sketch titled SalaryViz in the L09 folder.
Submission
When you are ready to submit, please follow these steps.
If necessary, review the Code Style Guide and use Processing's built-in auto format tool. You do not need to use the precise coding style outlined in the guide, but whatever style you use, your code must be clear, concise, consistent, and commented.
If necessary, review the How To Submit document for a reminder on how to submit to LEARN.
Make sure to include a comment at the top of all source files containing your name and student ID number.
Create a zip file called L09.zip containing the entire L09 folder and all its subfolders.
Upload L09.zip to LEARN. Remember that you can (and should!) submit as many times as you like. That way, if there's a catastrophe, you and the course staff will still have access to a recent version of your code.
If LEARN isn't working, and only if LEARN isn't working, please email your ZIP file to the course account (see the course home page for the address). In this case, you must mail your ZIP file before the deadline. Please use this only for emergencies, not "just in case". Submissions received after the deadline may receive feedback, but their marks will not count.