As mentioned in the previous section, one line is going to be the reason why your program stopped running. Different development environments (e.g. Dr. Java, JBuilder, JCreator) will most likely report errors in a slightly different format, but the the error messages you receive in the console output will all contain the same basic information:
- The type of the error
- The line number which caused the error
- The line number which called the line which caused the error
- The line number which called the line which called the line which caused the error
- ...and so on, back to main, and in fact beyond main, through the Java runtime library methods that were called by the Java runtime environment on its way to executing your main method.
You should pay special attention to this information and use it as a starting
point for debugging your code. The following example shows a sample error
message.
| Code | What shows up in the interaction pane |
|
This code's |
Upon execution, we receive this message in the interaction pane. Line (b) tells us the type of the error: a null pointer exception. Then line (c) tells us which method of which class caused the error, along
with the line number of the statement within that method that caused the
error - in this case, line 26 in the Line (d) tells us that line 20 in the file BoardGoneMissing.java contains the statement from which the method shown in line (c) was called. And so on, all the way back to (Lines (g) through (j) tell us what methods were called by the Java runtime system in reaching execution of main(...), which are of no use to us.) In this case, it's easy to spot the assignment of null to room that resulted in the exception. In real life, it may be more difficult - room might have been set to null by a method called from outsideTheRoom() before calling insideTheRoom(..), for example. |
01: public class BoardGoneMissing {
02:
03:     public static void main( String[] args )
04:     {
05:         BoardGoneMissing program = new BoardGoneMissing();
06:         program.run();
07:     }
08:
09:     public void run() {
10:         // ...omitted code...
11:         Board room = new Board(12,12);
12:         // ...omitted code, that doesn't mention room
13:         outsideTheRoom( room );
14:     }
15:
16:     public void outsideTheRoom( Board room ) {
17:         // ...omitted code...
18:         room = null;
19:         // ...more omitted code
20:         double howFarFromHome = insideTheRoom( room );
21:     }
22:
23:     public double insideTheRoom( Board room )
24:     {
25:         room = null;
26:         Coordinate c = room.getClick();
27:         return Math.sqrt(   c.getRow()*c.getRow()
28:                           + c.getCol()*c.getCol() );
29:     }
30:
31: }
|
(a) > java BoardGoneMissing (b) NullPointerException: (c) at BoardGoneMissing.insideTheRoom(BoardGoneMissing.java:26) (d) at BoardGoneMissing.outsideTheRoom(BoardGoneMissing.java:20) (e) at BoardGoneMissing.run(BoardGoneMissing.java:13) (f) at BoardGoneMissing.main(BoardGoneMissing.java:6) (g) at sun.reflect.NativeMethodAccessorImpl.invoke0(Native Method) (h) at sun.reflect.NativeMethodAccessorImpl.invoke(NativeMethodAccessorImpl.java:39) (i) at sun.reflect.DelegatingMethodAccessorImpl.invoke(DelegatingMethodAccessorImpl.java:25) (j) at java.lang.reflect.Method.invoke(Method.java:585) (k) > |
Using this information, we can "trace through" the order of execution in our
code, which will lead us to the error.
Using the error message we receive from the console, start at the line which caused the error and trace backwards through the method calls that reached that line, asking yourself questions about your code as you go along. As a simple example, let's use the code example in step 1:
- I have a null pointer exception on line 26 What does that mean?
- It means that I am trying to call a method on an object whose value is null.
- What objects are present in line 26?
- Well, there are two objects on line 26:
candroom.Roomis the only object on which I am calling a method (in this case, thegetClick()method), so it must be the value ofroomthat's null.
- Well, there are two objects on line 26:
- I don't want
roomto be null. Why doesn't it properly refer to aBoardobject?- Maybe I forgot to initialize it. It's a parameter, so I need to look in the method that called insideTheRoom(...), which the error message tells me is on line 20 in the method outsideTheRoom(...).
- Is it declared in outsideTheRoom(..), or initialized?
- No. But look! It's set to null, and it isn't assigned a new Room object before the call ... that's my error!
- That's the problem: I don't create a new Board object and assign it to
roomafter I set it to null on line 18. (Or perhaps it shouldn't have been set to null ... its depends on what the program is actually intended to do, and that's not obvious because of the omitted code.)
After creating another board object and assigning it to room, you should re-compile and run your code again to test whether you've actually fixed the bug. And of course you may run into other errrs...
Certainly, the types of questions you ask yourself will change with your programming experience. This works for some errors, but not for all of them. If your code is too complicated for you to just be able to "see" the problem (and this is usually the case), then the next step often helps.
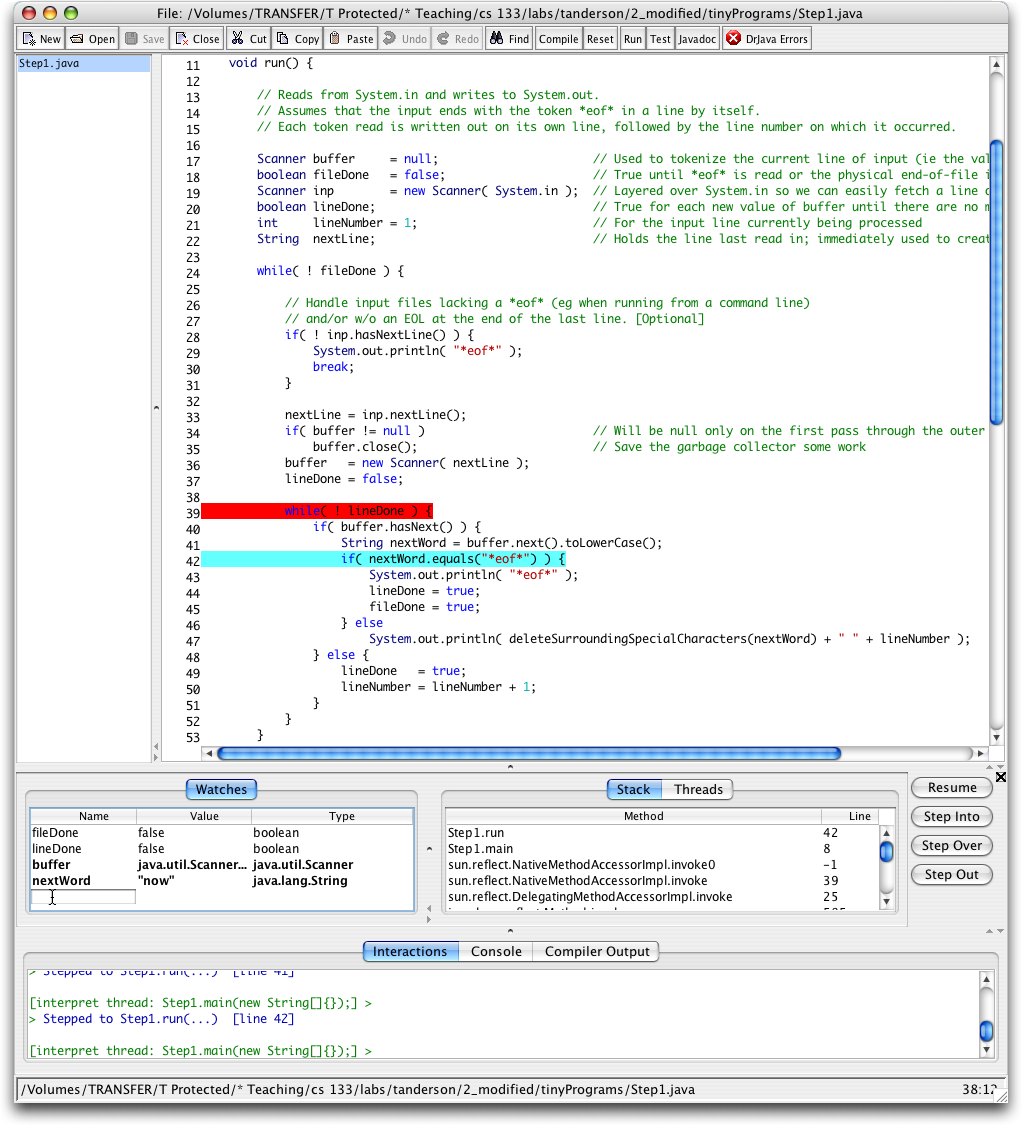 DrJava, like most Interactive Developent environments (IDEs), allows you to
step through your code one statement at a time. That is, after each statement
is executed, execution is suspended until you click a button. This enables
you to follow the sequence of statements actually executed, which may not
be what you expected ... which may be your problem. In DrJava, you accomplish
tracing by
DrJava, like most Interactive Developent environments (IDEs), allows you to
step through your code one statement at a time. That is, after each statement
is executed, execution is suspended until you click a button. This enables
you to follow the sequence of statements actually executed, which may not
be what you expected ... which may be your problem. In DrJava, you accomplish
tracing by
- first entering Debug Mode via the Debugger > Debug Mode menu item;
- placing a "break point" on an executable statement at the beginning of your program -- e.g. line 06, containing the statement program.run() of our first example program -- via the Debugger > Toggle Breakpoint on Current Line menu item;
- clicking the Run button, which will cause execution of your program to begin, but pause when it reaches the statement on which you have set a breakpoint;
- clicking either the Step Into or Step Over buttons to execute the next statement. (These two buttons are equivalent if the statement on which execution is paused does not contain a method call. If it does contain a method call, then Step Into causes DrJava to call the method and pause on its first executable statement, whereas Step Over causes DrJava not to enter the method and pause, but rather to completely execute the current statement and pause before executing the next statement in the same method, thus "stepping over" the method call.
Of course, if you already partially localized your bug, you can put your initial breakpoint at the beginning of the code you believe contains your bug, and start debugging from there.
While you're in debug mode, DrJava can "watch" variables for you: type a variable name in the "name" cell on the first unused line of the Watch pane, and DrJava will display its value for you. Even better, DrJava will update those values for you automatically as you step from line to line via the Step Into or Step Over buttons.
As you do this, the Stack pane will show you the chain of method calls by which the program reached the current line of execution from main(...).
Moreover, while the program is paused, you can type commands into the interaction pane and they'll be executed. You can call methods, such as those that return a value from inside an object visible from the statement at which execution has been suspended.
More information on using Debug Mode in DrJava can be found in DrJava's Help menu.
Another approach to isolating the problem is use System.out.println() to
print out the value of variables as your program executes.
The example below is identical to the one from step 1, except I have included output to the console (in bold).
| Code | Console Output |
|
We execute this code's |
The console output from running this code. We should take note of the following things:
|
01 public class Test
02 {
03   private Person p;
04
05   public static void main( String[] args )
06   {
07     System.out.println("Creating a Test object");
08     Test t = new Test();
09     System.out.println("Done program");
10   }
11
12   public Test()
13   {
14     System.out.println("Inside Test constructor");
15     System.out.println("p = " + p);
16     String personName = p.getName();
17     System.out.println("personName = " + personName);
18     int nameLength = personName.length();
19     System.out.println(nameLength);
20   }
21 }
|
(a) > java Test (b) Creating a Test object (c) Inside Test constructor (d) p = null (e) NullPointerException: (f) at Test. |
As you can see, printing out our own messages to the console would have revealed the source of the problem to us immediately. For more complex and involved code with several different classes/methods interacting with one another, visually displaying this information is very useful.
In general, consider including System.out.println() statements in the following helpful places:
- Just before the line which causes the error in order to look at the values of any variables or the return values of any method calls.
- At the beginnings of methods to check whether or not they are being called
(e.g.
System.out.println("Method xxx of class yyy called.")). - At the ends of methods/code blocks to ensure that the execution makes it
all the way through
(e.g.
System.out.println("Method xxx of class yyy completed.")). - Inside of loops and
ifstatements to ensure that they are being entered (or are repeating an appropriate number of times). - After initializing variables to ensure they are initialized to the correct values.
- Anywhere else you feel would be helpful in the context of the error (e.g. never be afraid to include more output than necessary).
A good general rule is "never delete these System.out.println(...) statements." Instead, declare a boolean variable - eg debug - and execute the print statements only when the value of that boolean is true. In this way you can turn debugging output on and off as needed.
public class Something {
    private boolean debug = true;
    ...
    public int someMethod(...) {
        ...
        if( debug ) System.out.println(...);
	    ...
    }
    ...
}
Difficult bugs require methodical analysis and testing.
- Identify as many symptoms as you can using the debugger and/or print statements to gather data.
- Devise one or more hypotheses that might explain the problem.
- Devise a way to test each of these hypotheses. Each test should tell you whether an hypothesis is or is not true.
- Carry out the test by setting a breakpoint and examining variables or by adding print statements (and perhaps other code).
- If this suffices to identify the bug, you're done (of course!). Sometimes, however, an hypothesis will merely move you closer to the bug. (For example, "room is being set to null in the first half of method M," tested by printing out the value of room half way through the code or by setting a breakpoint half way through the method.) When that's the case, you need to repeat this process, devising one or more new hypotheses and repeating this process. ("Room is being set to null in the second quarter of method M," for example, given that you've just established that it's set to null in the first half.)